

The core SAST engine of Semgrep is written in OCaml. There are a lot of good technical and historical reasons for this that I’ll leave for another time. An important consequence of using a language with a (relatively) small ecosystem like OCaml is that there aren’t a lot of libraries for things like observability, which are critical for running industrial software like Semgrep on hundreds of thousands of code repositories, and keeping it both reliable and performant.
We’ve made heavy use of existing libraries like the OCaml OpenTelemetry library, and have contributed to, and written, some of our own. Last year I gave a workshop at FunOCaml explaining how we use and benefit from observability, and how you too can implement it in your OCaml program. After the workshop though, I had multiple people come up to me and ask “what about continuous profiling?”, to which my answer was, “it just doesn’t exist yet”. Well, 7 months later, I’m happy to announce that we’re releasing 1.0.0 of Pyro Caml, a continuous profiler for OCaml.
Case Study: How Pyro Caml Helped Identify a Taint Analysis Optimization
What is Continuous Profiling?
Before we dive into the technical details, we must first understand the difference between a normal profiler and one that is continuous. Profiling is a form of dynamic analysis that measures aspects of a program like time complexity, instruction usage, or where in the code time is spent. OCaml has a handful of profilers, such as the built-in ocamlprof, magic-trace, or olly, to name just a few. What differentiates a continuous profiler is that it is not run directly by the developer, but instead runs in production, continuously profiling the program, and reporting that data back to a central location.
For us this distinction is incredibly important. We had gotten by with the other profilers mentioned, along with more general profilers like prof, but that only got us so far. Semgrep runs static analysis on code, and in general, we try to avoid giving our engineers easy access to the user code we analyze. So if we can’t get a local copy of the source code to profile on our own machines, continuous profiling becomes the only option. Additionally, metrics and tracing only help root out performance problems when you know where to look, and that becomes rarer as a code base matures. We must profile while customers scan their code, or else we are destined to live in the dark.*
Requirements for a Continuous Profiler
So we know a continuous profiler is an incredibly helpful tool, but Semgrep has some additional restrictions.
Runs under gVisor
We’re a security company, so we like to keep things secure, which means when we scan someone’s code, we sandbox the scan using gVisor, which implements the Linux API in userspace. One part of the Linux API it does NOT implement, is perf_event_open**, which is how profilers like prof work, and is what some continuous profilers are built on (like ddprof). Our first attempt used one of these tools. Everything worked perfectly, even in our test environment, and then when we deployed to production, we got some nasty errors about how this system call just did not work. Eventually we figured out it was gVisor, and although we were bummed it didn’t work, I was secretly excited that this meant I might get to write my own profiler.
Supports OCaml
There are some very nice continuous profilers out there that integrate well with a language’s runtime (and therefore don’t use perf_event_open), such as Pyroscope or Datadog’s Python Profiler. None exist for OCaml. At the time, we knew that if we were to build our own, we'd want to build on an open source standard so we could make it useful for the community (and so we wouldn’t have to write as much tooling from scratch). Notably, Pyroscope’s SDK is open source whereas Datadog’s is not.
Maturity
OpenTelemetry also had a (at the time pre-alpha) profiling specification, along with a profiler kindly donated by Elastic Search. This profiler is very, very cool, and works via eBPF programs that would decode stack traces from raw memory, including interpreted languages like Python and Ruby. It’s some crazy stuff, and it’s worth digging around in that repo if you find this post interesting. Running this locally with an OCaml program resulted in some very mysterious stack traces, and we soon realized to get useful info out of it, we’d have to write our own eBPF program for walking OCaml stacks. Though that does sound like fun, the OTel signal was also pre alpha, along with the rest of the infrastructure, so even if we did tame eBPF, there were still a bunch of what-ifs. Additionally, we weren’t even sure if this would run in gVisor (after further research, we found out it does not). So this wasn’t a strict no, but a very risky and difficult project if we went down this path.
Performance and Safety
Finally, a continuous profiler needs to be performant and safe! If a profiler significantly impacts the runtime of your program, then you can’t run it in production easily. The existing OCaml profilers are solid tools but they impose significant overhead, which makes them poor starting points. If you’re trying to figure out what’s making your program slow and your profiler adds an 80% overhead… remove the profiler. In a perfect world, a profiler adds no overhead, but we’re willing to accept ~5%. Additionally the profiler must be safe, as in if it fails (whether that be walking stacks, reporting data, etc.), it should not affect the correctness of your program.
Enter Pyro Caml
At this point, it was obvious nothing off the shelf would really work for us, and our options to build our own were integrating with Pyroscope or the OTel profiler. I already listed the risks with the OTel profiler, so what about Pyroscope? Their Rust SDK is nice, and is set up to accept data from novel sources, not to mention that the backing infrastructure is something we can easily setup in a Grafana instance we already have. So the infrastructure part is trivial (unlike the OTel profiler)and the SDK is nice – we just needed a way to gather the performance data without perf_event_open and actually get it over to the Pyroscope SDK.
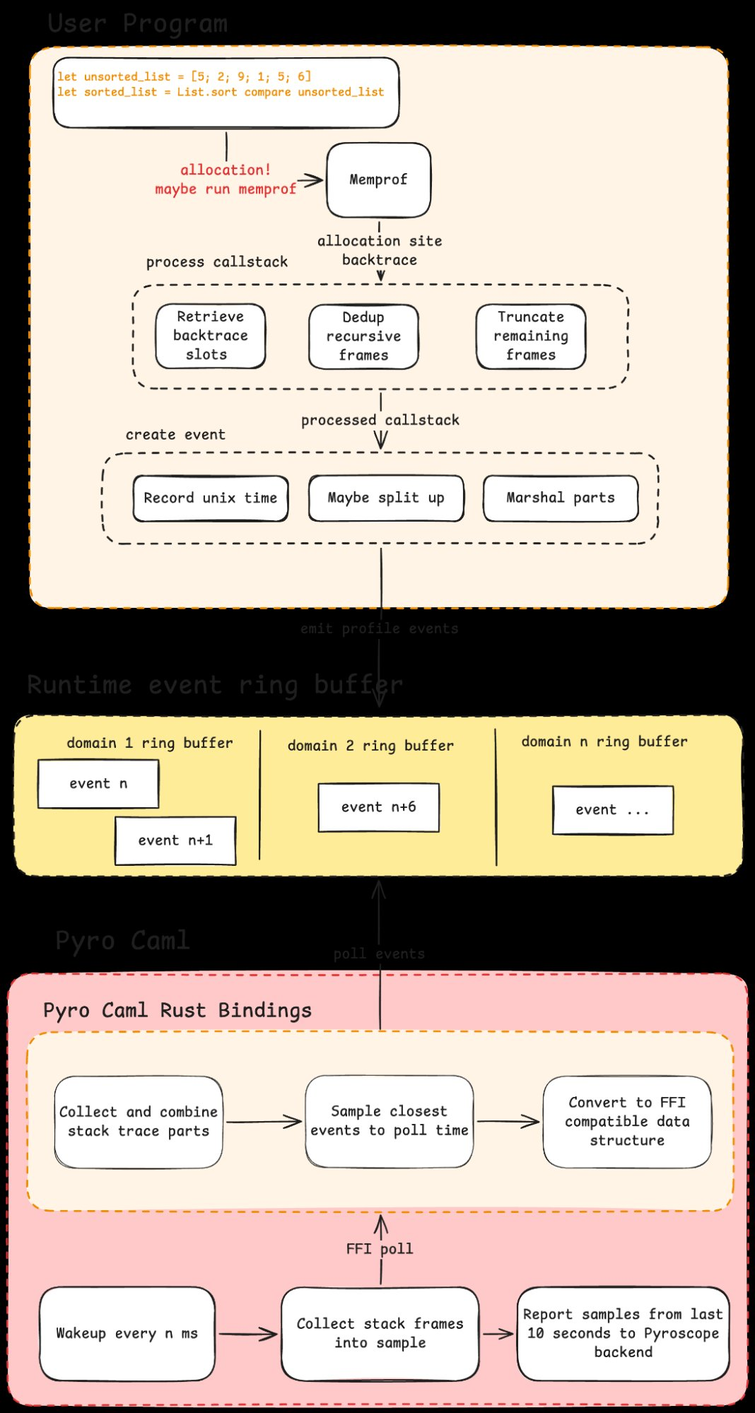
What follows is the architecture of Pyro Caml:
Call Stack Sampling via Memprof
First, we needed a way to get the call stack of the currently running program. There are a few ways to go about this, such as looking at the raw memory and using something called DWARF symbols, similar to how eBPF and prof do it. Once upon a time I actually did something like this for our library OBackward, which provides pretty backtraces on segfaults for OCaml programs.
The TL;DR; is that sort of code is the complete opposite of portable, and although the compiler does a good job of generating DWARF symbols, the backtraces are nowhere near as helpful as what’s built into the runtime.
So the other option is using what’s built in, specifically Printexc.get_callstack, which is a function in the OCaml standard library that returns the current callstack. But a problem arises here: even if we have a nice way to get this over to the SDK, how do we easily instrument programs with this? A nice way would be to write a PPX (OCaml macro) that adds the code everywhere you want, which is what the Landmarks library does. Unfortunately, unless this code is faster than most of your code, you run into an issue where repeated calls to a fast function that’s instrumented, results in that code path taking longer because the instrumentation takes awhile. This means you need to be careful with these PPXs, and so you must also then know what parts of your program are slow or fast, at which point the profiler doesn’t satisfy our requirements.
This is why many profilers are statistical sampling profilers. Instead of measuring when a function starts and stops, along with its callstack, it just samples at a set frequency. This means that the profiler overhead is constant, instead of a function of how many times it’s called. The results end up being a little less accurate, but it’s more than enough to get by.
So how can we do this with OCaml, when we don’t have access to eBPF/perf_event_open, and would rather not introspect the raw memory? We can be a bit tricky and use the built in memory profiler for OCaml, called Memprof. Memprof runs a set of callback functions on a configurable percentage of allocations. This is nice because we know for a program like Semgrep, we spend pretty much all of our time doing pure CPU work, which involves a lot of allocating.
This means we’re sampling at some frequency of allocations, not time. So we’re still liable to get inaccurate profiles and introduce overhead if a function allocates more than another, which is a problem we’ll treat in the next section.
Lastly, one small bonus is that the Memprof callback provides a callstack of where the code was allocated already! So one less thing for us to do. In fact, the Memprof callbacks run on their own stack, so if this wasn’t the case, we’d have to be even trickier.
Emitting Profiling Events via the OCaml Runtime Events
Now that we had a bunch of samples, we had to do two things. First, we needed a way to interpret the samples such that we had samples at a regular interval, instead of whenever the Memprof sampler decided to run. Then we needed to actually call into the Pyroscope SDK, and send the samples off to our infrastructure. As mentioned before, the longer the sampling process takes, the more likely we are to skew our data, and networking/interpreting samples could take a long time. So if we got these samples written to disk quickly, they could be processed and sent to another program, minimizing our overhead.
OCaml 5 introduced Runtime Events, which are exactly what we want!
> [...] the runtime events tracing system which enables continuous extraction of performance information from the OCaml runtime with very low overhead.
This lets us write events to a file backed ring buffer and read it out from another program. It’s similar in kind to the Java Flight Recorder, or Go’s builtin runtime tracing. So now we can write these samples and read them from another OCaml program.
To help us keep track of the samples, we also recorded in these events the time at which they were taken. The corresponding profiler program read these events and started to process them. Since the samples were not guaranteed to be taken at a set time interval, what we did was try to generate as many as possible, and then choose whichever was closest to the proper sample interval. This meant for a given sample interval, we had many possible samples to choose from, which allowed us to choose a sample timestamped sufficiently close to the single point in time we wanted to generate a complete callstack for. The downside here was that for programs that didn't emit many samples, we lost accuracy for function calls that lasted less than the time of the sample interval, and may not have received samples for intervals of time that didn't allocate often.
Consider this flame graph of an example program (read this as, func_a calls func_b, which in turn calls func_d). Assume that we are sampling every 10ms (the default for Pyro Caml):
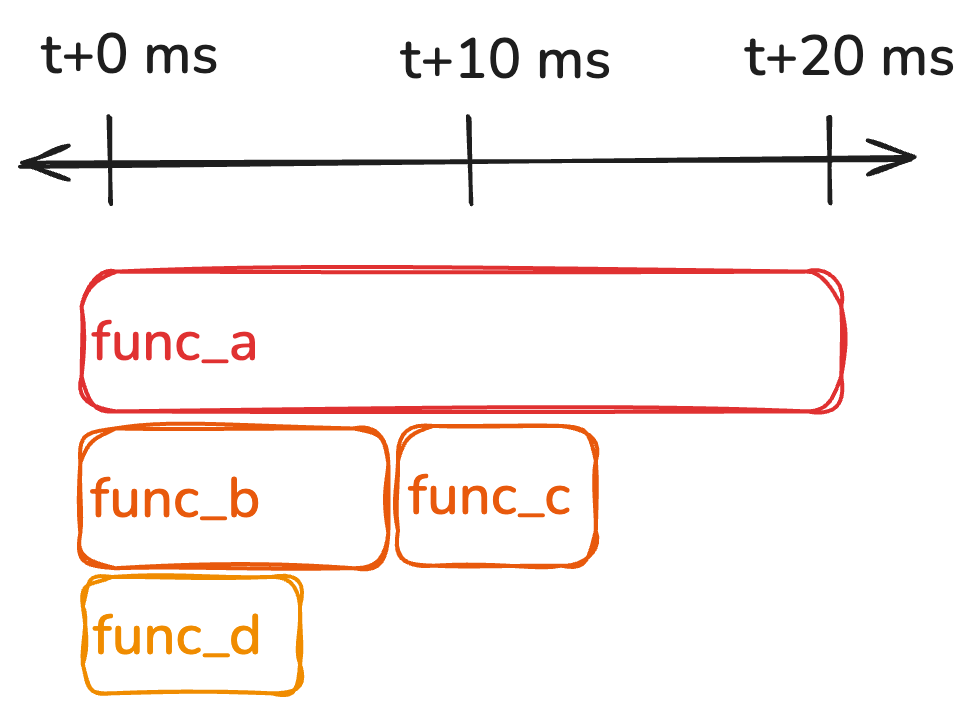
Say we're sampling at time t+10. Ideally we would want the sample to contain the callstack that occurs exactly at t+10, but since we only emit samples whenever code allocates, we can’t guarantee this. We can take advantage of the fact that if we generate a sample in the interval [(t+0),(t+10)] it must include func_a in the callstack, as the duration of func_a is greater than the sample interval. So we know that at the very least, with our Memprof approach, as long as we emit a sample once every 10ms, the callstack will be identical to the ideal callstack we described for any function whose duration is at least 10ms.
So what about functions whose durations are less than the sample interval? To get a sample equivalent to the ideal sample, func_c must be allocated, and our Memprof callback must be triggered for this allocation to emit a sample. If that happens, we’re in the clear, as Pyro Caml chooses whatever sample is closest in time to the sample interval. So in this case, if func_c allocates and Memprof is triggered sometime before t+10,we choose that as our sample, and we will have an ideal sample. If func_c did not generate a sample, and func_b did, our callstack differs from the callstack at a single instant in time, resulting in a less accurate sample.
Luckily we have a knob we can turn, specifically, what percentage of allocations Memprof runs on. So you can imagine that if we run Memprof on every allocation, i.e. generate a sample every time we allocate, then as long as all the functions that we run allocate, we will always have ideal samples. Code that doesn’t allocate is rare in our code base (we rarely do networking or file io), so on that front we’re ok.
Sadly, if we run Memprof on every allocation, our program slows to a crawl. Even worse, if we run on every allocation, the profiler will begin to affect the runtime of functions that allocate often much more than those that allocate sparingly, skewing the results. For example, if emitting a sample per allocation takes 1ms (in practice it’s much faster), and we allocate 20 times in func_c, but only once in func_b, our profiler will report that func_c takes longer than func_b, even though that’s clearly not true.
We need to remember that if the overhead of the profiler is significant and not evenly distributed through the program, it can introduce measuring errors. So what we can do is measure the overhead, and then keep increasing the rate at which Memprof runs, while measuring the difference between times the samples we chose were emitted, and the actual sample time.
Formal testing still needs to be done, but we've found that most OCaml programs allocate enough, and the overhead of sampling is low enough, that we achieve accurate enough profiles for targeting bottlenecks that take 20-30% of the run time.
Calling OCaml from Rust
Now that we have our samples, the last step is getting them to the Pyroscope backend. The Pyroscope SDK is designed such that there is a main runtime program with a “backend” that samples at some configurable frequency. This backend has a report function that returns essentially a set of callstacks from the last 10 seconds, and the runtime handles converting them to the proper wire format, and actually sending them off. This means instead of having to rewrite all of this in OCaml, we can just have the backend poll function call into our OCaml code. That’s right, we’re going to call OCaml from Rust!
I’ve been wanting an excuse to use caml-rs, a library for nice Rust FFI to OCaml, since I first saw it, and now I finally have one. The library is incredibly well designed, and based on the work of a lot of very smart OCaml folks. If you’re interested in the nitty gritty of how it actually works, I’d recommend poking around in the underlying ocaml-boxroot library by Gabriel Scherer, or watching Stephen Dolan’s talk on it here. Thanks to their approach, you can pretty much just recreate the OCaml type in Rust with equivalent types (e.g. Option<String> for OCaml’s string option), slap a simple macro on it, then call the ocaml::import! macro, and write the function more or less how it appears in the OCaml code. Finally you just initialize the OCaml runtime and pass a reference to said runtime as the first parameter to the function, and you’re all set! Of course you need to build and link the OCaml code, but Rust’s build system makes that pretty easy. The error handling was a bit rough around the edges when I chose the wrong type, but for the most part it “just worked”.***
Now we have all of our pieces, here’s what it looks like in full:
Pyro Caml in Action
Running this locally, we ran into a few segfaults, which the aforementioned Stephen Dolan and Gabriel Scherer have helped with. After poking at the sampler rate a bit, I heuristically got <5% overhead, which seemed good enough, so we deployed it to run on ~1% of scans. We saw significant overhead in production, so I went back and did some small hacks, such as limiting the size of the call stack (Pyroscope cuts it off at ~1k frames anyways), deduplicating recursive call frames, and simplifying some of the serialization code. Here’s what a week's worth of profiling looks like:
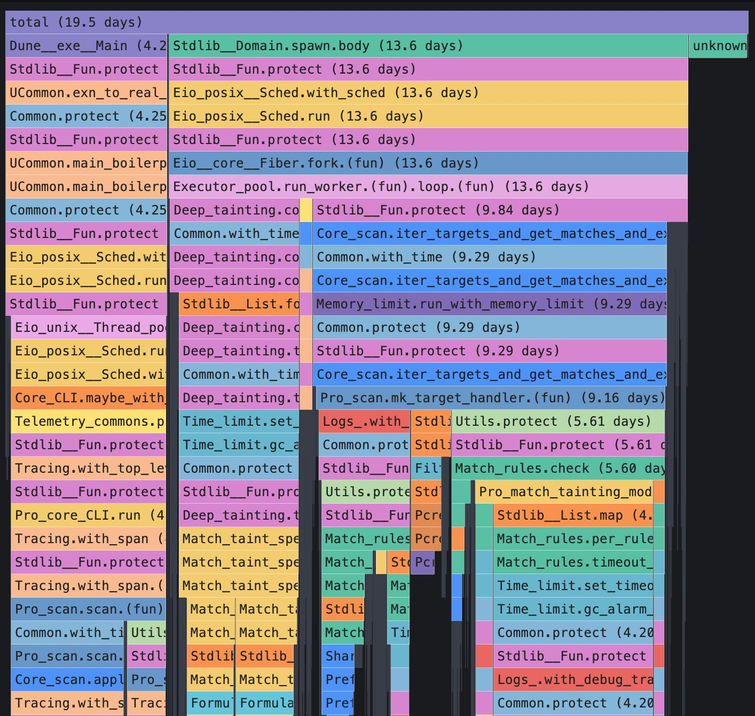
Try as I might, I could not get the full flame graph on the screen, nor would I want to since there are some proprietary function names further down the stack.
You’ll notice at the top the span says “19.5 days”, even though I just said this was from a week’s worth of scans. Remember that profiles record CPU time, not wall clock time, so we can easily exceed a week's worth of time via parallelism. Additionally this is a sum of all profiles for the 1% of scans we sampled, and Semgrep runs millions of scans a week.
Caveats + Future Work
There are a few caveats with this approach, the first of which is you may have noticed an “unknown” section in the flame graph. This happens when we don’t receive a sample in the sampling period, and this often happens in Semgrep due to our use of FFI calls to the PCRE library. Currently there is no way to emit samples from FFI code, although in theory there are a few workarounds, which I won’t get into. Another related part that’s notably missing is time spent in the garbage collector, or OCaml runtime in general. The Runtime Events system we mentioned earlier has a bunch of builtin events that can track this info, so it’s something that most likely just needs wiring up. Another missing piece is that a good continuous profiler also profiles your memory usage, and will tell you where allocations are coming from, how long they’re living, etc. Again, the builtin events provide this information, and Pyroscope supports memory profiling, we just have not had time to wire the bits up! Finally, one last drawback here is that OCaml, like any good functional language, makes heavy use of recursion. Although I made an effort to deduplicate recursive frames, very often we will still blow by the 1k frame limit that Pyroscope imposes. This means if you have a deeply nested function that’s taking far longer than it should, there’s a good chance that it might be truncated, and you might not realize that’s the source of a bottleneck. There might be some smart things we can do here, but we haven’t had the chance to explore.
Conclusion
Although not perfect, this profiler has sat in production for a few months now chugging along on over a million scans, without any major hiccups. It has been critical to helping us improve the performance of Semgrep, giving us key insights into where our bottlenecks are. In the next blog post of this series, I’ll discuss a major bottleneck in Semgrep that Pyro Caml helped us find and fix with confidence.
Check out the code here, or the opam package here.
*You might think “ just find a good corpus of OSS repos to scan”, we did, they come nowhere close to what you will find in some of our users’ private repositories. Every once in a while a performance problem would arise and a user would actually share code with us. I’m not even phased by +100k LOC in a single file anymore.
**We’re actually not completely sure why gVisor does not implement perf_event_open, their docs don’t give any specific details, they just state:
Note: Enabling profiling loosens the seccomp protection added to the sandbox, and should not be run in production under normal circumstances.
***An interesting side note here is that this presents a really nice way to call a garbage collected language from Rust, and only have the garbage collector run when you explicitly opt into it. Syntactically the overhead is minimal. I imagine the opposite direction, calling Rust from OCaml, would be equally painless, but I have not had an excuse to do that just yet.

.jpg)