

Introduction
OCaml 5 introduced numerous changes. Perhaps the largest and most-anticipated was the introduction of multicore support, which allows for shared-memory parallelism, something that was previously unavailable in OCaml. This required a significant overhaul of the garbage collector and memory allocator, the details of which were explained in the excellent Retrofitting parallelism onto OCaml (Sivaramakrishnan et al.).
The OCaml maintainers focused on achieving performance backwards compatibility for single-threaded programs while also ensuring good performance for multi-threaded programs. In support of this goal, they ran numerous benchmarks measuring both time and memory use with the new runtime for a variety of programs in the OCaml ecosystem. Nearly all showed similar or better performance: a great achievement given the complexity of this change.
Unfortunately, Semgrep's interfile analysis appears to be dissimilar to the workloads that were tested as part of this effort. When we first got Semgrep building with OCaml 5 in late 2023 (shoutout to Brandon Wu for this work!), we found significant memory consumption regressions, in some cases more than a 2x increase! This led to resource exhaustion and crashes in our benchmarks. We couldn't ship something like that to our customers. However, we needed to upgrade. We wanted to use the improved support for parallelism, as well as a variety of other features like algebraic effects made available in OCaml 5. We were also aware of the risk of getting stuck on an old version and potentially missing out on newer package versions as our dependencies began relying on OCaml 5.
Initial investigation
Some brief initial research turned up that garbage collector (GC) compaction had not yet been implemented in OCaml 5. Compaction accomplishes two goals: First, it reduces fragmentation in the heap. Fragmentation can cause waste because the unused fragments are not always perfectly matched to future allocations (though the allocators in both OCaml 4 and 5 do quite well at minimizing that). Second, and perhaps more important, it returns unused memory to the operating system.
With other priorities to focus on, we assumed that the lack of compaction was likely the culprit (spoiler alert: it wasn't) and decided to make another attempt at upgrading once compaction was implemented.
Second attempt at upgrading
When OCaml 5.2 was released with an implementation of compaction, I tried again to upgrade, and encountered the same problems with memory consumption. This was unsurprising: compaction still does not run automatically, so we'd have to explicitly insert calls to Gc.compact (). But where? How might I determine when to compact? Was the lack of compaction even the problem, as we had assumed? I needed better data.
In order to figure out what was going wrong, I needed a few pieces of information. I needed to know (1) how the application actually uses memory, (2) to what extent memory remains uncollected even after it is no longer referenced (i.e. how aggressive the garbage collector is), and (3) how much memory the whole process overall is actually using (accounting for wasted space).
I started with Memtrace, an excellent tool by Jane Street, based on the statistical memory profiling available from the OCaml runtime. Memtrace records information about where and when memory is allocated and deallocated. With a trace of a single execution of a program, you can see an overview of memory consumption by time or dive deep and answer specific questions about how memory is used.
I familiarized myself with the tool by profiling Semgrep on OCaml 4.14, and was able to find and fix a few minor inefficiencies in the process. For example, I found a hash table that was excessively large, and contributed significantly to memory usage.
This gave me a preliminary understanding of how Semgrep used memory in OCaml 4. But I needed to know how it differed with OCaml 5. Unfortunately, the statistical memory profiling upon which Memtrace relies was unimplemented in OCaml 5.0 through 5.2. An implementation was staged for 5.3, which at the time was unreleased. I was targeting 5.2 anyway, and wanted to minimize any possible differences between what I measured and what we would be using in production.
To do so, I backported the new implementation of memory profiling to the 5.2 compiler branch (I later learned that this was unnecessary: it had already been backported, but not merged into the 5.2 branch where I looked).
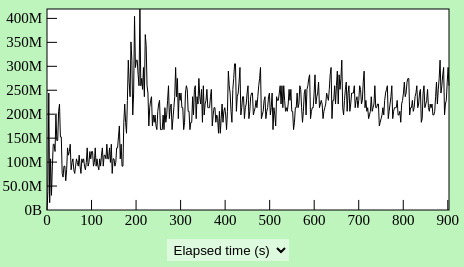
With a working Memtrace setup on OCaml 5.2, I had what I needed to start comparing the details of Semgrep's memory consumption between OCaml 4 and 5. I began by scanning OWASP Juice Shop with our interfile engine and our default ruleset. We often use this repository to exercise our interfile engine.
OCaml 4 with no GC tuning (Peak memory just over 400M)
OCaml 5 with no GC tuning (Peak memory just over 550M)
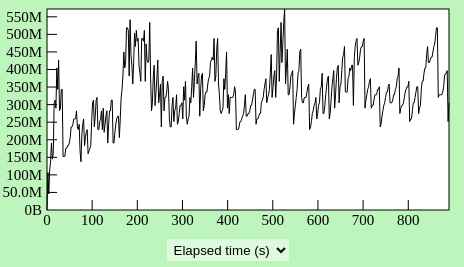
It was immediately clear that the actual live memory increased dramatically in OCaml 5! This meant that either the actual memory used by the program increased, or memory was not getting collected as quickly by the garbage collector (Memtrace considers values to be live from the time they are allocated until the time they are collected, regardless of when they are no longer referenced). This also meant that the lack of compaction was at the very least not the whole story. If the only difference was compaction, we would expect to see similar behavior on Memtrace and observe the difference only in Resident Set Size (RSS).
So, if the lack of compaction was not the culprit, what might be? It couldn't be the allocator either (which also changed dramatically in OCaml 5), because poorer allocation strategies would also not be reflected in Memtrace: Memtrace measures only the memory allocated by the program, and does not include wasted space in the heap. This left only two likely possibilities. First, the program could actually have been allocating more memory, and keeping references to it for longer. This could happen if, somehow, the standard library or some of our dependencies changed behavior in OCaml 5 in such a way that dramatically increased memory usage. The second possibility was that the garbage collector was leaving unreferenced memory around for longer in OCaml 5 than in OCaml 4.
The first possibility seemed far-fetched, so I decided to explore the second.
Garbage collector tuning experiments
OCaml exposes some details about the garbage collector in the Gc module. In particular, it allows programmers to set the GC parameter space_overhead, which essentially controls how aggressively the garbage collector will clean up unused memory. A low value for space_overhead indicates a preference to collect more aggressively, at the cost of increased time spent on garbage collection. A high value indicates the opposite. The default, in both OCaml 4 and 5, is 120.
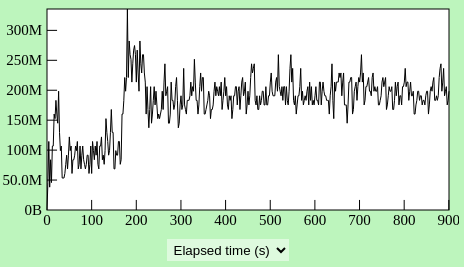
Because our problem was excessive memory consumption, I decided to start reducing space_overhead. This quickly yielded positive results. An interfile scan on Juice Shop with space_overhead set to 40 in OCaml 5 exhibited improved memory characteristics (as measured by Memtrace) compared to OCaml 4 with default GC settings! The time spent was also comparable.
OCaml 5 with space_overhead set to 40
However, the memory use reported by Memtrace does not tell the whole story. It reports the total memory used by uncollected values at any given moment. It does not include any additional memory wasted for any reason, such as heap fragmentation or unused memory that has not been returned to the operating system. To get an accurate picture of the total memory used, I had to measure Resident Set Size (RSS). I wrote a short script to run a program, poll the operating system for its RSS every second, and plot the results.
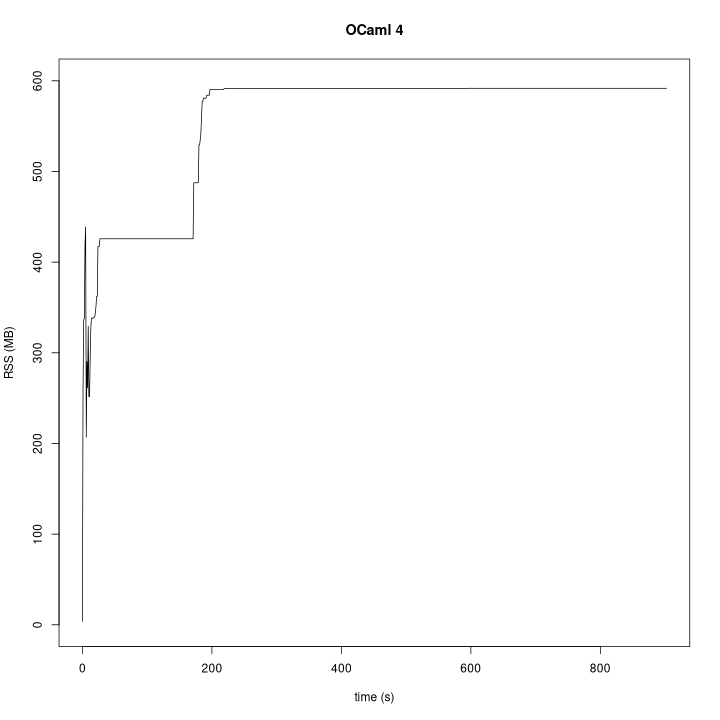
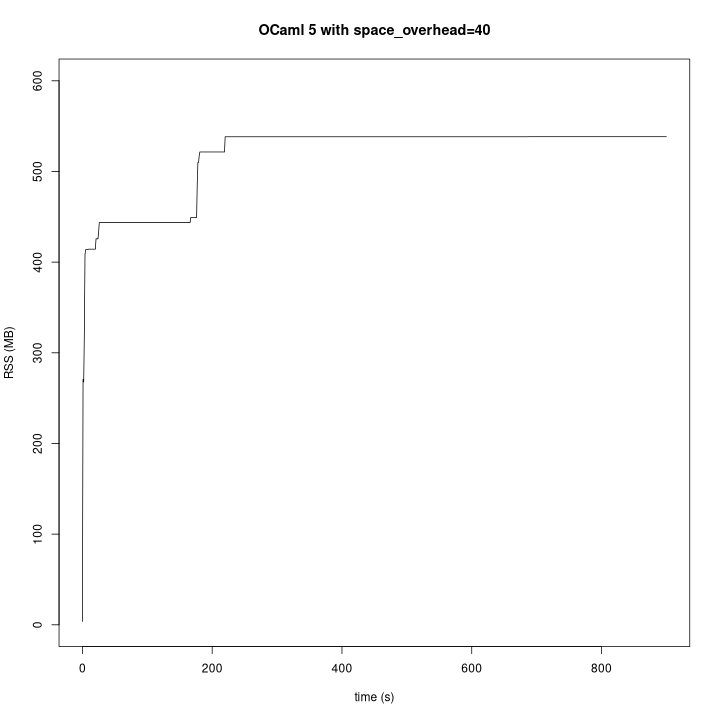
This looked promising! It closely mirrored the Memtrace results. It showed somewhat improved memory consumption and comparable time spent!
These results strongly suggested that the memory issues we encountered were due entirely to different major garbage collector behavior (as opposed to different allocator behavior, a lack of compaction, or some combination). They also suggested that simply tuning the major GC would allow us to return to the performance characteristics of OCaml 4! However, I needed more than a couple of runs on a single repository to reach that conclusion.
I decided to repeat this experiment by scanning Blaze Persistence, a larger repository that we often use for benchmarking. I learned that setting space_overhead to 40 was inadequate on this larger repository: I still saw significantly increased memory usage. I eventually found that a setting of 20 worked well to mimic the performance of OCaml 4. However, applying this to Juice Shop and other smaller repositories led to a time regression! It was too aggressive a setting, and the garbage collector spent too much time trying to keep memory usage low. In contrast, benchmarks showed the opposite problem on even larger repositories: time somewhat improved, but memory usage degraded. Further experiments showed that on the largest repositories in our benchmarks, a space_overhead of 15 was appropriate.
Dynamic garbage collector tuning
After some thought, a possible solution seemed obvious. Why limit ourselves to a single static value for space_overhead when there seemed to be no suitable single value? I started by looking more closely at the primitives available in OCaml's Gc module to see what was possible. Two things jumped out at me as possible building blocks for dynamic GC tuning: GC alarms and the GC stats functions. The GC alarms provide a facility for us to trigger any arbitrary action at the end of each major GC cycle. The GC stats functions can provide us with a variety of information about the garbage collector and the heap. Specifically, they can tell us the size of the major heap.
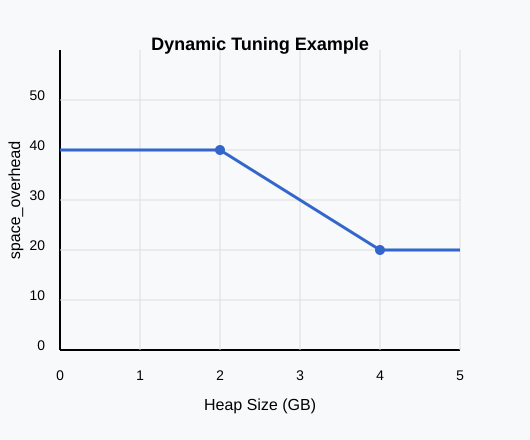
I combined these primitives into a utility which, at the end of each major collection, adjusts space_overhead based on the size of the major heap by linearly interpolating according to its configuration. Each adjustment is very fast relative to a major collection and performs minimal allocations. We use the Gc.quick_stat function which provides only values which are immediately available (including the heap size). We perform some simple computations to arrive at a value for space_overhead, and changing space_overhead requires no ancillary work from the runtime: it simply records the new value.
For example, one could configure the utility to use a minimum space_overhead of 20, a maximum of 40, and to adjust space_overhead between these two values when the major heap size is between 2 GB and 4 GB. In this case, if the major heap were 1 GB, space_overhead would be set to 40, the least aggressive setting. At 2 GB, it would also be 40. At 3 GB, it would be set to 30. At 4 GB, it would be set to 20, where it would remain as the heap size increased.
This allowed us to use less aggressive GC settings for smaller repositories, prioritizing speed over memory consumption in these cases. It also allowed us to ramp up the GC aggressiveness as the heap size grows, shifting the priority to memory usage over time when scanning larger repositories. Of course, the goal here was to mimic the performance of OCaml 4 in order to deliver the upgrade with minimal negative impacts to our customers, rather than to choose tradeoffs between time and memory in isolation.
While this approach is simple, and in retrospect fairly obvious, it does work. We have been using OCaml 5 in production since the middle of February 2025, and the rollout has been entirely uneventful.
Open-sourcing our garbage collector tuning utility
We have open sourced this utility in the hopes that it will be useful to others in the OCaml community. The source code is available on GitHub and on opam as “dynamic_gc”. While I used this only to mimic the performance of our workload on OCaml 4, its potential applications extend beyond that for anyone who wants more control over GC tuning than is directly achievable with the OCaml standard library.
Future work
Use live memory instead of heap size
At the moment, we tune the garbage collector based on the major heap size. This is not the same as the amount of live memory. When values are garbage collected, the amount of live memory decreases but the heap size is not reduced until there is a compaction. This distinction is particularly important in OCaml 5, where (at least as of OCaml 5.3) compaction is never run automatically. As of OCaml 5.2, it is available, but it requires an explicit call to Gc.compact ().
I chose this approach because (a) our workload tends to use more memory over time as the analysis proceeds, so the distinction for us is unimportant at the moment, and (b) it allowed me to use Gc.quick_stat in favor of Gc.stat, which triggers a major collection in order to provide up to date data. I didn't investigate in detail how Gc.stat behaves when called from a GC alarm, which is triggered at the end of a major collection. In theory it seems like it could quickly return valid data without triggering another major collection in that case, but because it is unimportant for our current use case, I did not investigate whether it actually does.
In the future, we could consider basing this computation on live memory instead of heap size. This would likely yield better behavior, especially for applications that vary in their memory usage and do not regularly call Gc.compact.
Use a more sophisticated controller
Go uses a PI controller to adjust the aggressiveness of its garbage collector and implements a soft memory limit with similar aims as our dynamic GC utility. While this is not directly analogous to my work, we could use it as a source of inspiration. In comparison, my approach here is simplistic. It's based only on the current heap size and does not take into account the rate of new allocations or the rate at which the garbage collector is actually finding dead values to collect.
It is possible that a more sophisticated controller would improve the tradeoff between time and memory, allowing us to spend less time garbage collecting for any given memory constraint, and vice versa.
Make this tunable by end users
Semgrep has many sophisticated users who care about and tune performance, and they don't all have the same desires. Some prefer to throw big machines at Semgrep and prefer to see fast scans above all else. Some like to limit resource consumption and don't mind if it means longer scan times. Many are in between. It is increasingly clear that there is no one-size-fits-all solution.
In the future, we may expose the constants used to tune the garbage collector to end users through flags. This would allow users to tune the GC based on their preferences.
If you have ideas for future work or want to stay updated with the latest developments at Semgrep, join our Community Slack to stay up to date.


.jpg)