View findings in Semgrep AppSec Platform
Semgrep Code generates a finding when a rule matches a piece of code in your codebase. You can use Semgrep AppSec Platform's Code > Production backlog page to view all of the findings generated by Semgrep Code after it scans your codebase.
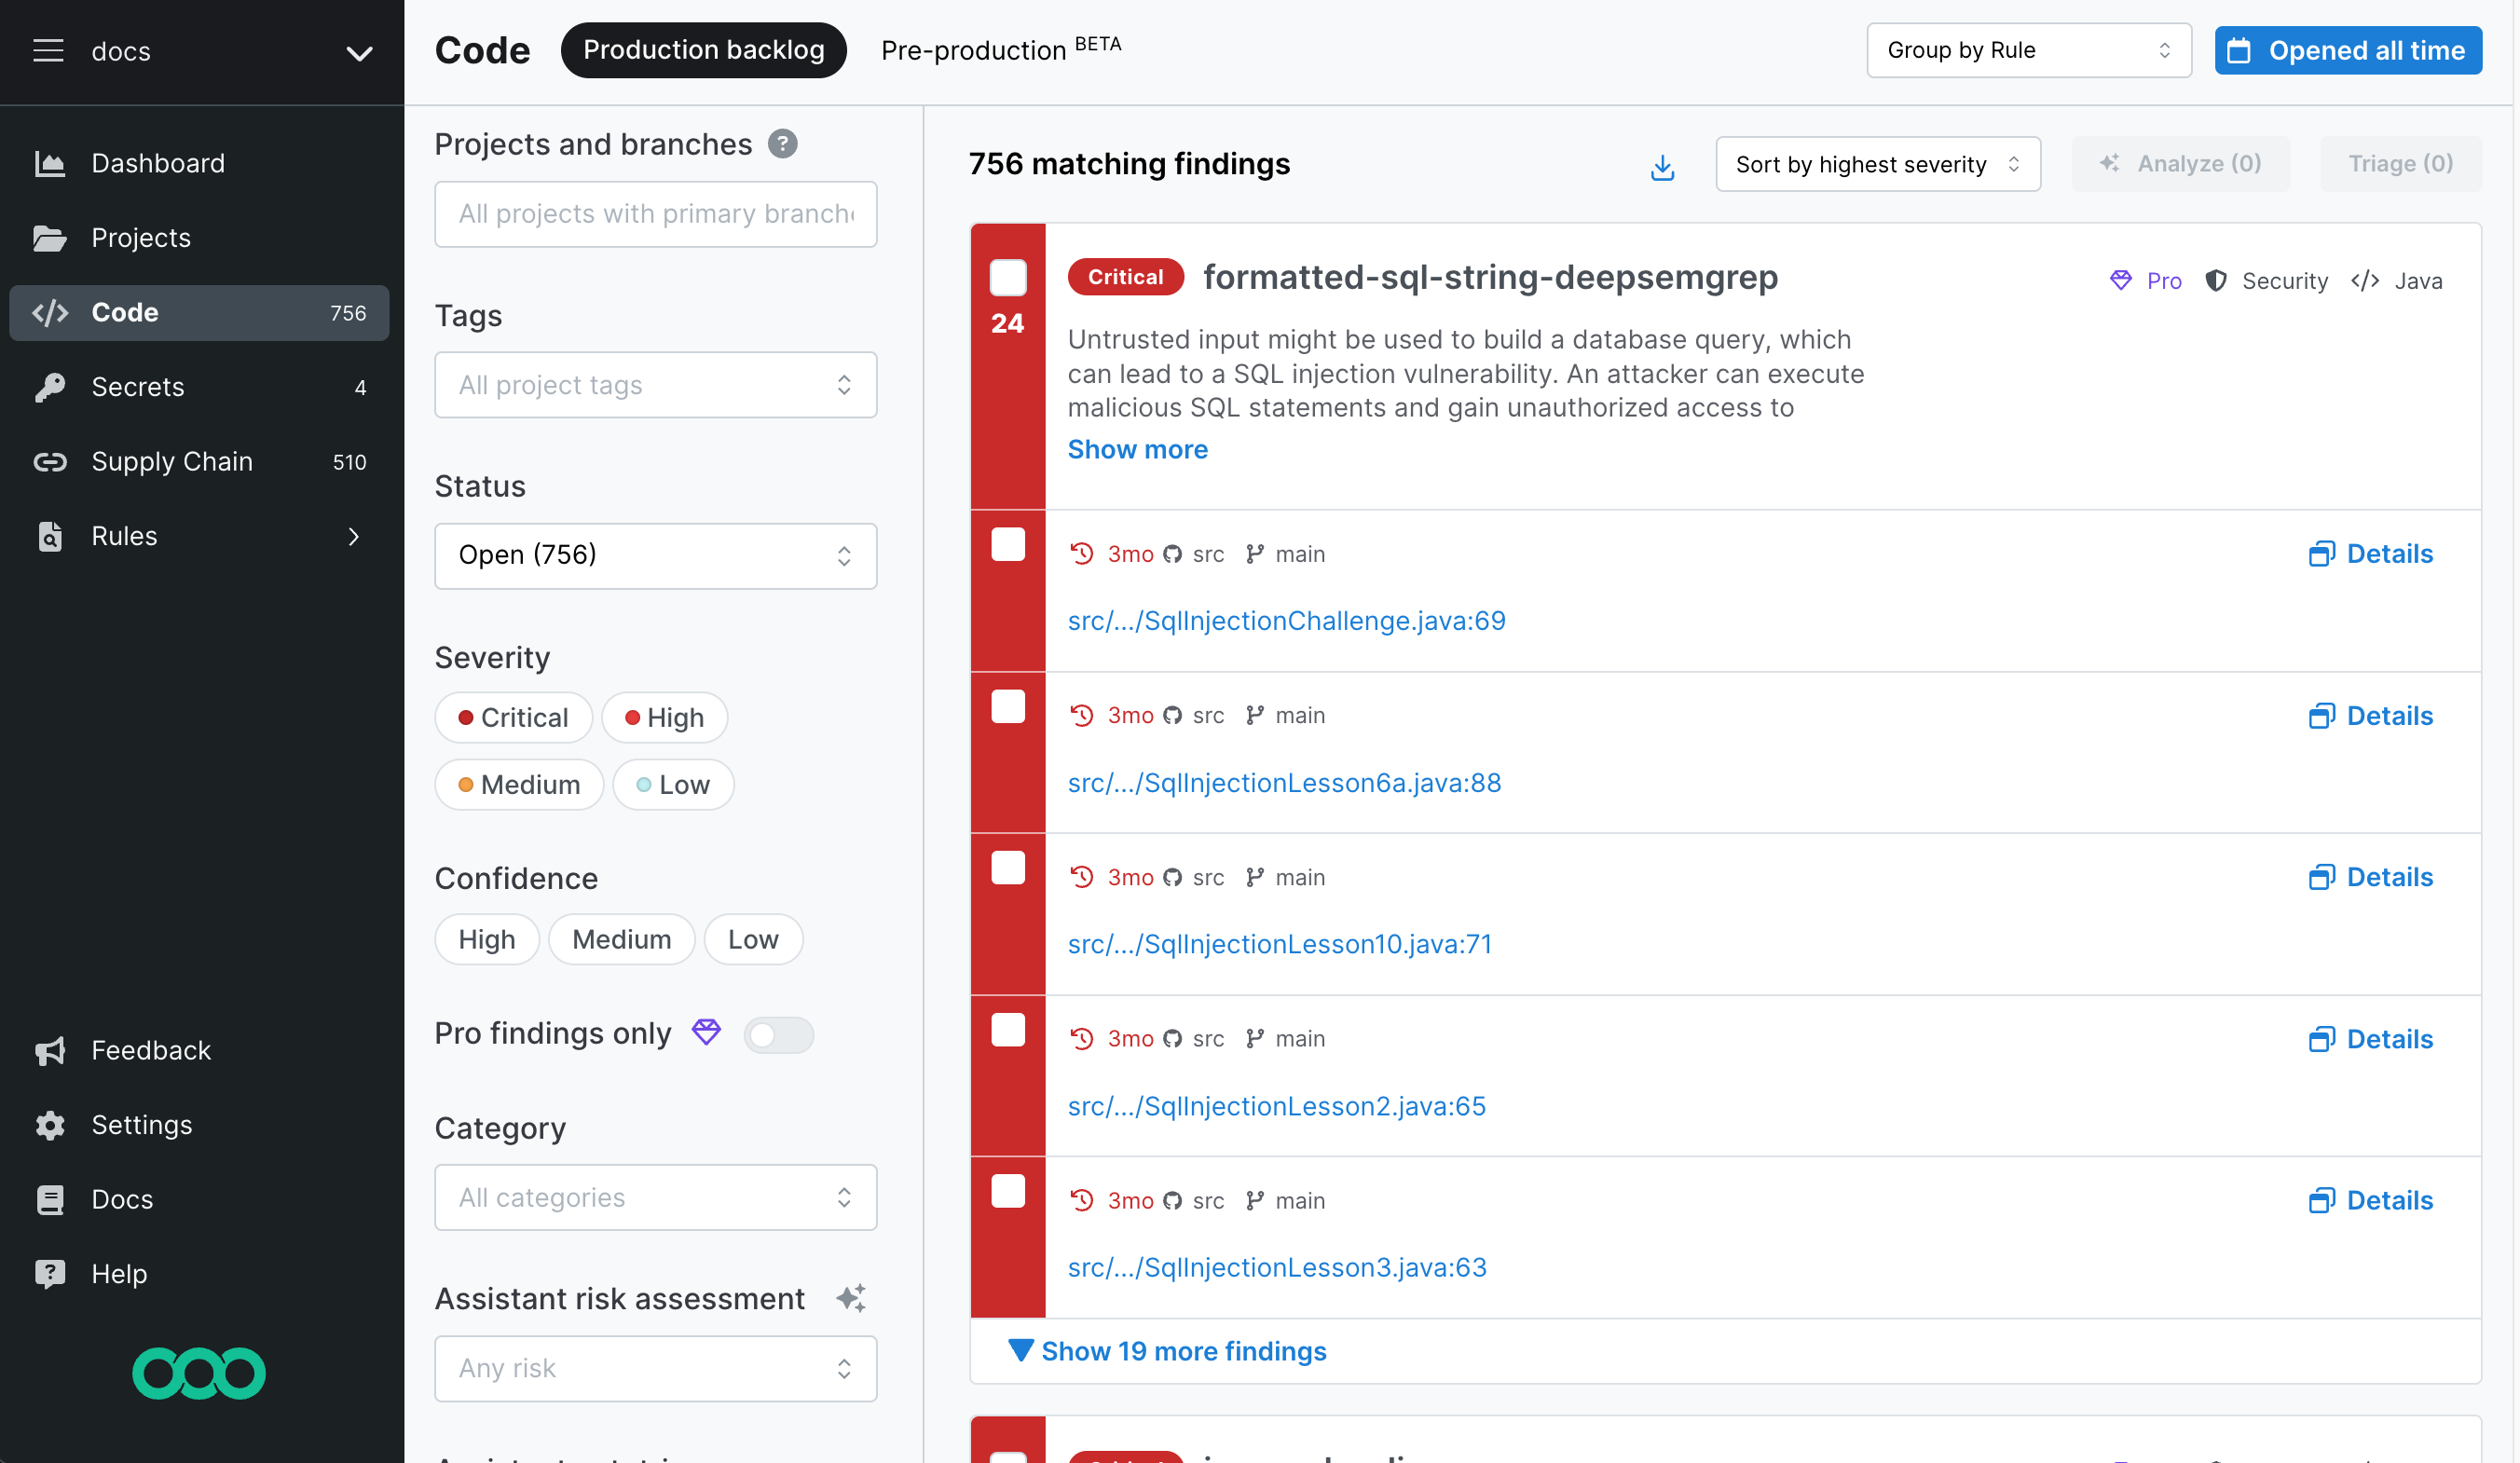 Figure. Semgrep AppSec Platform's Production backlog page.
Semgrep Assistant users can also view the Pre-production list of findings. This beta feature allows users to see the findings that have been filtered out by Assistant for auditing purposes.
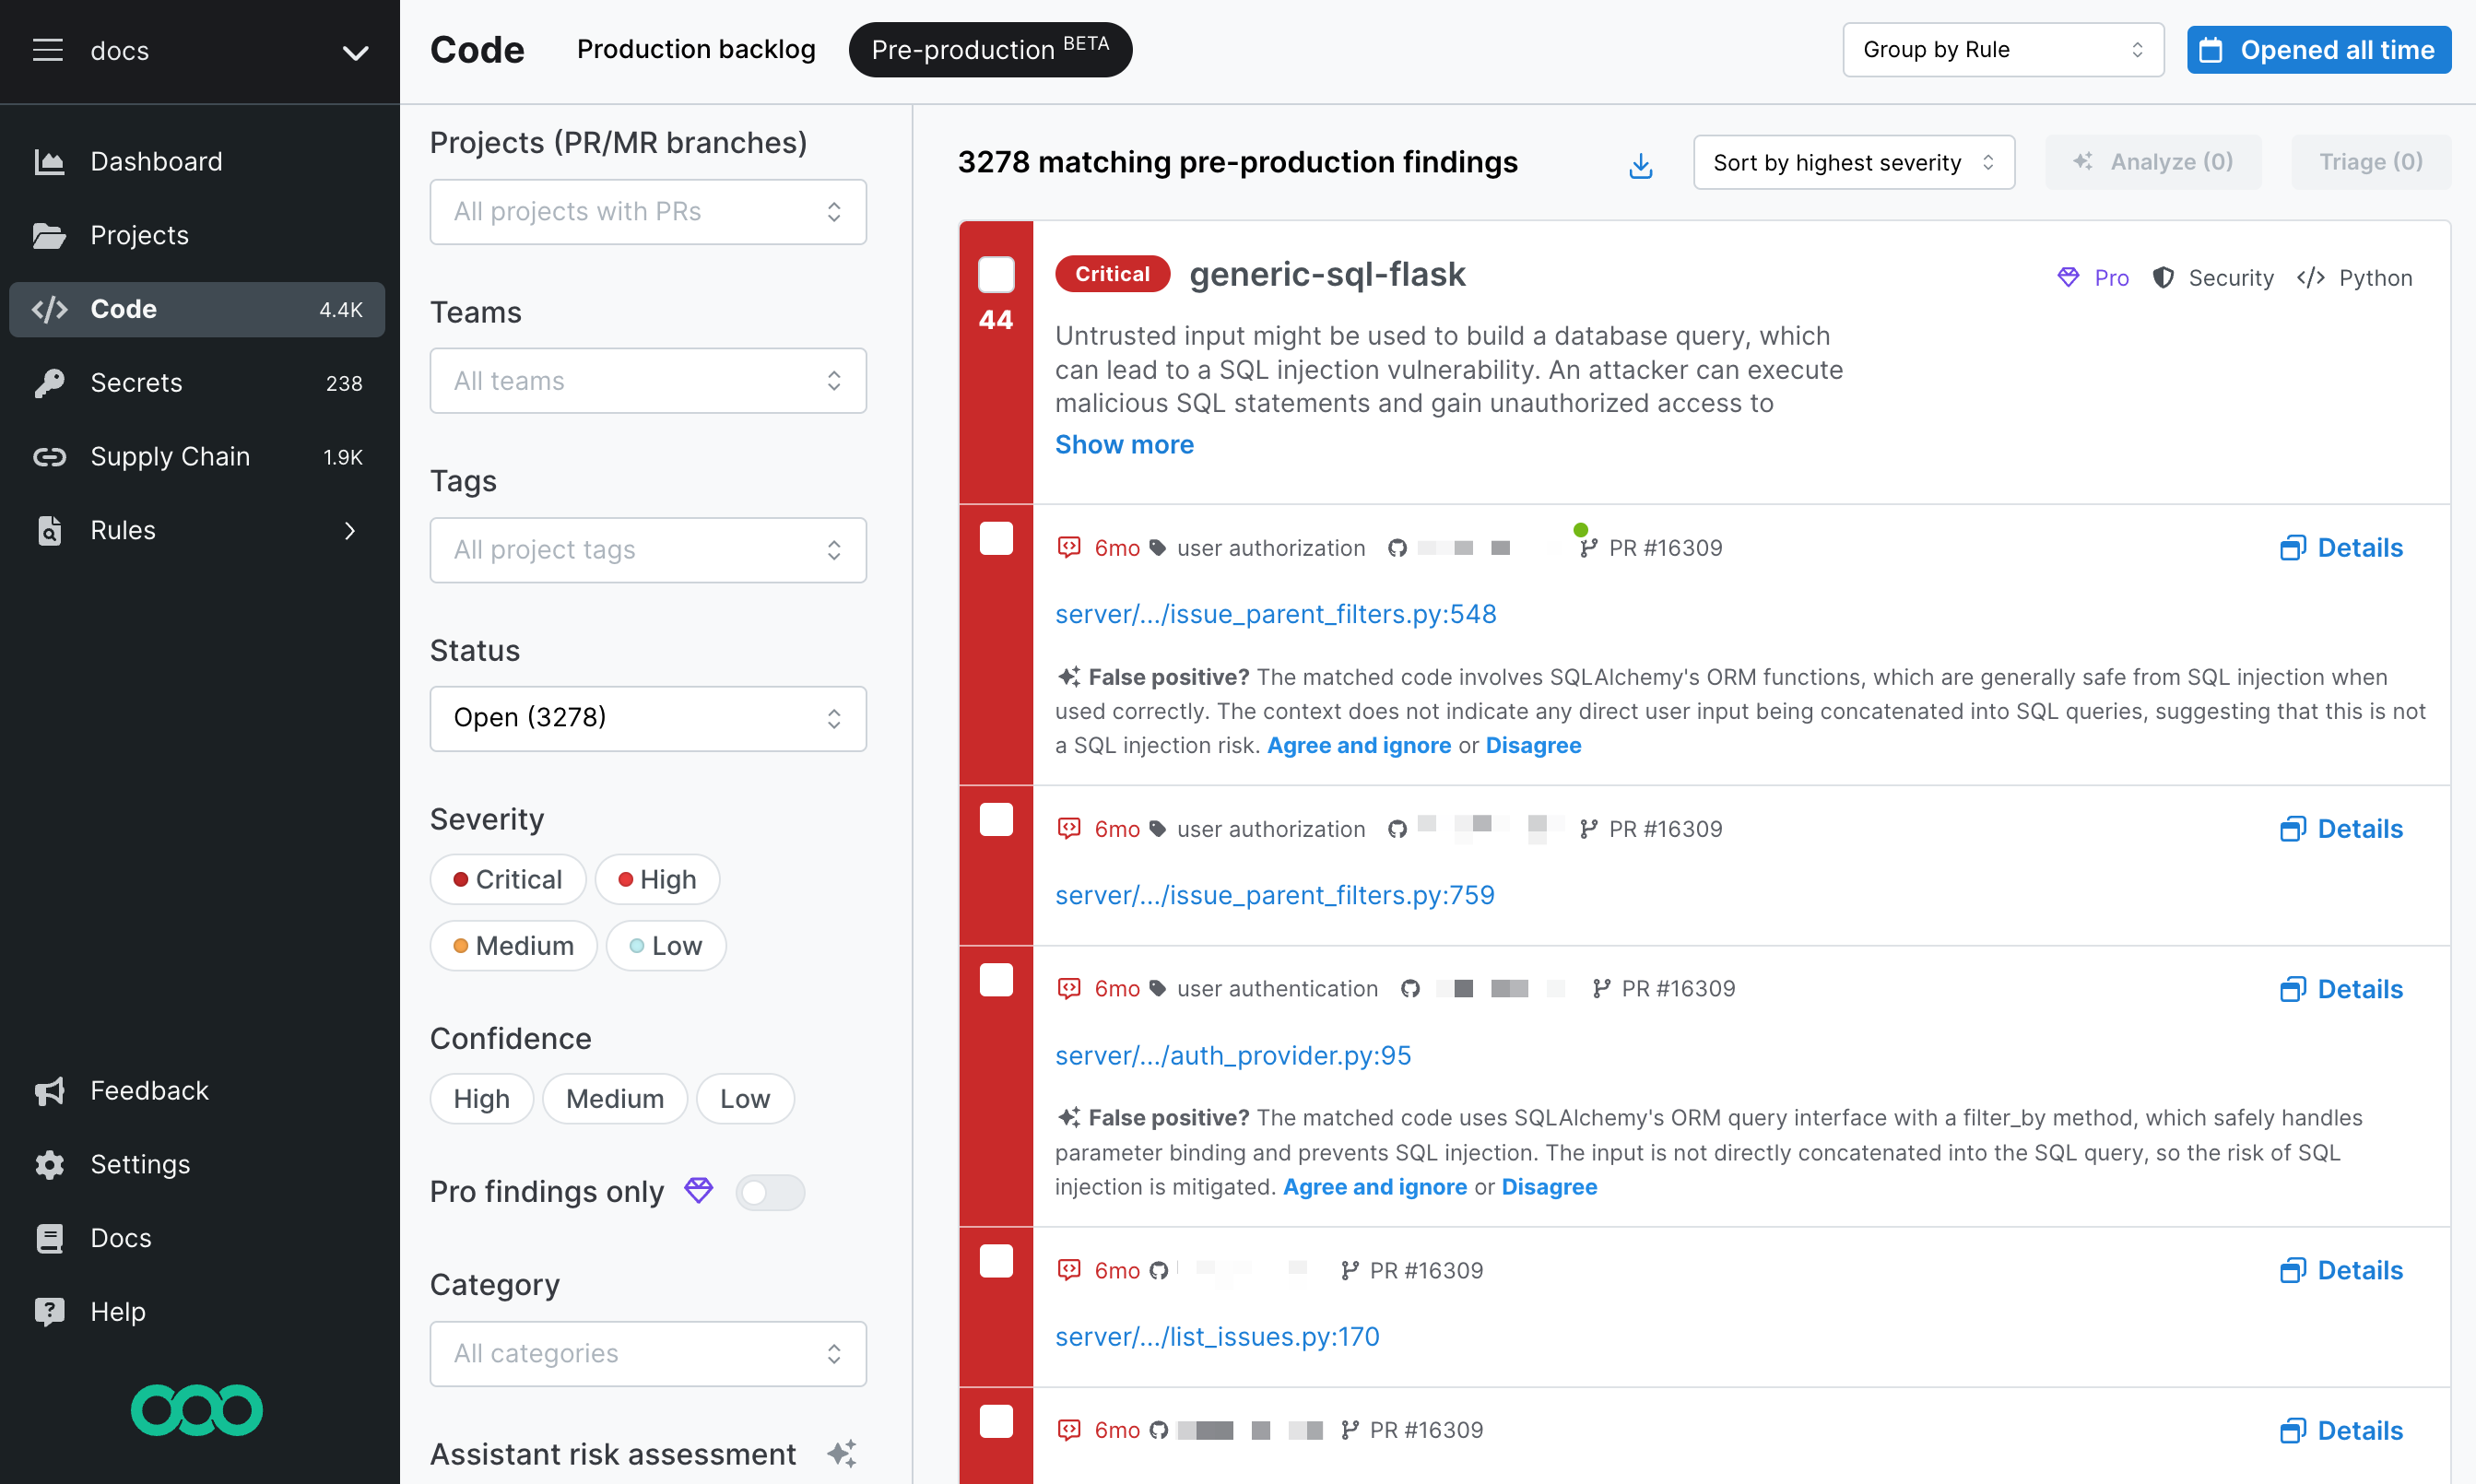 Figure.Semgrep AppSec Platform's Pre-production backlog page.
Navigate to the Production and Pre-production backlogs
To view your findings in the Production backlog:
- Log in to Semgrep AppSec Platform.
- Click Code.
To view your findings in the Pre-production backlog:
- Log in to Semgrep AppSec Platform.
- Click Code > Pre-production.
Page structure
The page structure of the Production backlog and Pre-production tabs are identical. These pages consist of:
- The top bar, where you can set the page's grouping view and time period.
- The filter panel, which you can use to group and filter for specific findings.
- Information about findings identified by Semgrep Code. Each finding in the list includes:
- The name and description of the rule used to generate the finding.
- The name of the project.
- A link to the commit where the finding was first identified.
- A link to the lines of code where the finding was most recently seen.
Group findings
By default, Semgrep groups all of the findings by the rule Semgrep used to match the code. This view is called the Group by Rule view.
Semgrep sorts findings by severity. For a given severity, Semgrep further sorts findings as follows:
- Findings generated by custom rules
- Findings generated by Pro rules
- Issue count in descending order
- Findings ID in ascending order

To view findings individually, toggle Group by Rule to No grouping using the drop-down menu in the header. Findings are displayed based on the date they were found, with the most recent finding listed at the top.

Time period and triage
Quickly view all the findings your organization has fixed in a previous time period, such as a quarter or half-year, by using this filter.
The time period filter allows you to see which vulnerabilities were opened, fixed, or triaged during a certain period of time. The time period filter is not additive; it is a filter operation that precedes other filters on the page. For example, if you select Last triaged and select the status Status Open filter, no findings appear because, by definition, there are no triaged findings that are also open.
The following filters are available:
- Triage state:
- Last opened
- Last triaged
- Last fixed
- Time period:
- Last day
- Last 7 days
- Last 30 days
- Last 3 months
- Last 6 months
- Last year
- All time
 Figure. Time period and status filters.
Default page view
A single finding may appear in several branches. These appearances are called instances of a finding. Several instances of the same finding may differ in which line of code (LOC) they are on or in their triage state. For example, on production the finding may be on line 20, but the same finding was moved further to line 26 in feature-branch-a.
Semgrep automatically recognizes that they are fundamentally the same finding and deduplicates these instances so that you do not get an inflated count of findings per ref that the finding is present in.
By default, the Code page displays findings from the primary branches of all repositories (projects), arranged by most recent scan. You are viewing the primary branch's instance of that finding, so you may see variations in LOC or triage state when comparing the finding across branches.
When filtering by primary branch and triage status, the filters are applied based on the triage status of the finding on the primary branch. This means that on some feature branches, the instance may already be Fixed, but on the primary branch, the finding is still Open. The finding status on the primary branch is updated when the PR or MR is merged and Semgrep has scanned the code.
- If you do not see any findings, or there are zero findings after a scan has concluded, check the Projects page to view the findings count, if any, and to set a primary branch, if it is not already set.
- The total count of findings in the Projects page is based on the primary branch.
Export findings
You can export findings to a CSV file. Semgrep can export up to 10,000 most recent findings. To export more than 10,000 findings, you must use the API.
Semgrep exports all findings to the CSV file regardless of the filters you apply on the page.
Export findings by navigating to the product page and clicking the icon near the time filters.
 Figure. The download findings CSV button.
Click to view a description of fields included in the CSV.
| Field | Description |
|---|---|
| Id | The unique ID number of the finding. |
| Rule name | The name of the rule. |
| Product | The Semgrep product. Possible values are Code, Supply Chain, or Secrets. |
| Severity | The finding's severity. Possible values are Critical, High, Medium, or Low. |
| Status | The finding's triage status. |
| Assistant component | A descriptor, such as API, Payments processing, Infrastructure, that Assistant tags the finding with, based on the code's context. |
| Repository name | The name of the repository where Semgrep found the finding. |
| Repository URL | The repository URL. |
| Line of code URL | The URL to the specific line of code where the finding match began. A finding may be several lines long. |
| Semgrep platform link | A link to the finding's Details page in Semgrep AppSec Platform. |
| Created at | The time the finding was created in your timezone. |
| Last Opened at | The time the finding was last opened. |
| Branch | The name of the branch where the finding was detected. |
| Triaged at | The most recent time that the finding was triaged. |
| Triage comment | A triage comment created by the user. |
| Triage reason | The reason why the finding was triaged, created by the user. |
| Rule description | The description of the rule. This is the same as the rule's message key. |
The following fields are exclusive to Code scans:
| Field | Description |
|---|---|
| Confidence | The finding's confidence. Possible values are High, Medium, or Low. Only Semgrep Supply Chain and Code findings provide this field. |
| Category | The finding's category, such as best practices, security, or correctness. |
| Is pro rule | Boolean value that returns TRUE if the rule that generated the finding is a pro rule. |
| Assistant triage result | Provides Semgrep Assistant's assessment. Possible values are True positive or False positive. These values appear only if Assistant is enabled. |
| Assistant triage reason | A short AI-generated reason why Assistant thinks the finding is a true or false positive. These values appear only if Assistant is enabled. |
The following fields are exclusive to Supply Chain scans:
| Field | Description |
|---|---|
| Dependency | The name of the dependency where the findings was found. |
| Reachability | The reachability status of the finding, such as Reachable, No Reachability Analysis, or Unreachable. |
| Transitivity | States whether the finding originates from a direct or transitive dependency. |
| CVE | The CVE number that the finding is assigned to. |
| EPSS | The EPSS score, which estimates the likelihood that a software vulnerability can be exploited in the wild. |
The following fields are exclusive to Secrets scans:
| Field | Description |
|---|---|
| Secret type | Possible values include AI-detected, Generic secret, Connection URI, and so on. |
| Validation | States whether or not the secret was validated. |
| Project visibility | States whether the project (repository) is public or private. This feature supports GitHub-hosted repositories only. It returns an Unknown value for non-GitHub SCMs. |
Filter findings
Use filters to narrow down your results. The following criteria are available for filtering:
| Filter | Description |
|---|---|
| Projects and branches | Filter by repositories connected to Semgrep AppSec Platform and by findings in different Git branches. |
| Tags | Filter for findings based on the tags associated with the project. |
| Status | Filter the triage state of a finding. Refer to Triage statuses to understand triage states. You can filter findings with a status of Ignored further by reason: False positive, Acceptable risk, No time to fix, or No triage reason. |
| Severity | Filter by the severity of a finding. Severity is computed based on the values assigned for Likelihood and Impact by the rule's author. Possible values:
|
| Confidence | Filter by the likelihood of the rule to detect true positives. The higher the confidence, the more true positives the rule may detect. |
| Pro findings only | Filter for findings identified using Semgrep Pro rules. Also includes findings originating from cross-file or cross-function analysis. |
| Category | Filter by the type of security issue or vulnerability the rule detects, such as security, correctness, and maintainability. You can select more than one category at a time. See Finding categories for information on how Semgrep categorizes your findings. |
| Assistant risk category | Filter for findings based on Assistant's assessment of risk level of files based on the type of code identified. High-risk files contain sensitive information, such as authorization and authentication details, while low-risk files may be things like test files. You can further filter by file type, such as payments or tests. |
| Assistant autotriage | Filter by whether Assistant autotriage has determined the finding to be a True positive or False positive. |
| Action | Filter by monitoring, commenting, or blocking rules in your Policies. |
| Rule | Filter by rules included in your Policies page. You can select more than one rule or ruleset for filtering. |
| Ruleset | Filter by the ruleset name where rules that match the code belong. More than one rule or ruleset can be selected for filtering. |
Finding categories
A finding can be categorized in two ways:
-
Finding categorization based on the issue or code it detects:
- Anti-patterns
- Security vulnerabilities (such as dangerous function usage)
- Business or logic bugs
- Matches based on your own custom rules (such as organization-specific authentication logic)
Semgrep rules provide a metadata schema to identify these common categories. Semgrep findings include a
messagefield that describes the security issue or bug found in matching code. Additionally, findings can provide afixfield that fixes the issue by creating a suggestion within your source code management (SCM) tool, such as GitHub, GitLab, and Bitbucket. -
Finding categorization based on the validity of the match:
- True positive: Rules are written to match a certain code pattern. A true positive is a genuine match. The rule is capturing the code as intended.
- False positive: A false positive is a mismatch between the intended purpose of the rule and the code it matched. A finding is generated but does not meet the rule's intended need. Rules with a high false positivity rate are said to be noisy.
- False negative: A false negative is a finding that should have been found by a rule, but was not. This can happen for two reasons:
- A flaw in the rule's logic. See Reporting false negatives.
- A bug within Semgrep itself. See the list of Semgrep issues to file a bug report.
You can identify findings categorized under Security by their badge.
![]()
View details about a specific finding
To view in-depth information about a specific finding:
- Select the finding whose details you want to view:
- If the default Group by Rule is enabled, click the Details icon on the card of the finding.

- If the No grouping view is enabled, click the header hyperlink on the card of the finding. In the example screenshot below, the link is labeled detected-generic-api-key.

- If the default Group by Rule is enabled, click the Details icon on the card of the finding.
Add notes to findings
To add notes to the activity history of a finding:
- Select a finding where you want to view details or add notes, and then do one of the following actions:
- If the default Group by Rule is enabled, click Details icon on the card of the finding.
- If No grouping view is enabled, click the header hyperlink on the card of the finding. In the example screenshot below, the link is labeled detected-generic-api-key.
- If the default Group by Rule is enabled, click Details icon on the card of the finding.
- View or add the notes in the Activity section. To add a new note, click New note.
Dataflow traces
With dataflow traces, Semgrep Code can provide you with a visualization of the path of tainted, or untrusted, data in specific findings. This path can help you track the sources and sinks of the tainted data as they propagate through the body of a function or a method. For general information about taint analysis, see Taint tracking.
When running Semgrep Code from the command line, you can pass in the flag
--dataflow-traces to use this feature.
You can view dataflow traces in:
- Semgrep AppSec Platform by going to Semgrep Code's Findings page. For more details, see Path of tainted data in Semgrep Code.
- The PR or MR comments created by Semgrep Code running in your CI/CD system. To enable
this feature, see:
- GitHub users: Dataflow traces in PR comments
- GitLab users: Dataflow traces in MR comments
Get cross-file findings
To get cross-file (interfile) findings in your organization, follow the steps in Perform cross-file analysis.
View dataflow traces
Not all Semgrep rules or rulesets make use of dataflow traces, or taint tracking. Ensure that you have a ruleset, such as the default ruleset added in your Policies page. If this ruleset is not added, go to https://semgrep.dev/p/default, and then click Add to Policy. You can add rules that use taint tracking from Semgrep Registry.
To view the detailed path of tainted data with dataflow traces:
- Log in to Semgrep AppSec Platform, and click Code in the left panel to view your findings.
- Select the finding you're interested in, then do one of the following actions:
- If the default Group by Rule is enabled, click View details icon on the card of the finding.
- If No grouping view is enabled, click the header hyperlink on the card of the finding. In the example screenshot below, the link is titled tainted-sql-string.
- If the default Group by Rule is enabled, click View details icon on the card of the finding.
- In the Data flow section, you can see the source, traces, and sink of the tainted data. The example below displays the path of tainted data across multiple files because Semgrep Pro Engine was enabled. Clicking on a specific line in the trace will highlight it in the context of the file, while clicking on the file name at the top of the right pane will take you directly to that file in your source code manager (GitHub, GitLab, etc.). If you don't have code access enabled, you'll still see the link to your source code manager.

Data retention
Semgrep, Inc. retains findings data as long as an account remains active. We securely destroy data within 90 days of contract termination for our Enterprise customers.
Additionally, account owners may request data destruction at any time by contacting support@semgrep.com.
Further reading
- Learn how to triage and remediate Semgrep Code findings.
- See Semgrep Assistant for Semgrep Code for information on receiving AI-powered security recommendations when reviewing your findings.
Not finding what you need in this doc? Ask questions in our Community Slack group, or see Support for other ways to get help.